
Chart FX for WPF using the 2D vector graphics, 2D animation, images, graphics, animation and 3D space 3D text advantages, to provide not only innovative function interface, provide for your WPF application of a new generation of data visualization and analysis tools.
A new set of features has been introduced to improve your WPF project:
Statistical expansion
Add statistical analysis to your chart application.
The extension comes with all the API that handles mathematical operations and algorithms, including standard deviations, variances, regression lines, normal distributions, and F- testing.
![]()
real-time data
With Chart FX for WPF, you can bind data to observe real-time data trends.
Using real-time API enables charts to quickly process large amounts of data without affecting their performance using internal components. Real time API is very useful in processing financial data and applications that require accurate display of real-time data.
![]()
Density map
A supplement to the early Chart FX for WPF version atlas, which allows visualization of the number of data points in a particular area. It's very useful in quantity control or site clicks, tracking, and so on.
![]()
Infraredimages
A two-dimensional table that displays data in a gradient mode.
![]()
Pareto diagram
The Pareto diagram is the 2-8 principle of Vilfredo Pareto, an economist in Italy, who studies the distribution of wealth in different countries. That is, about 20% of the population controls most of the wealth of about 80%. Chart FX for WPF 8.1 allows you to easily set up a Pareto diagram.
![]()
Schedule conversion
The bubble chart is a valuable tool for comparing comparisons between three variables, making visualization of complex interdependencies visible. The overlapping bubble chart also provides another comparison parameter (size). Bubble charts, for example, can compare GDP, population growth, and inflation rates in different years in different countries on the same chart.
![]()
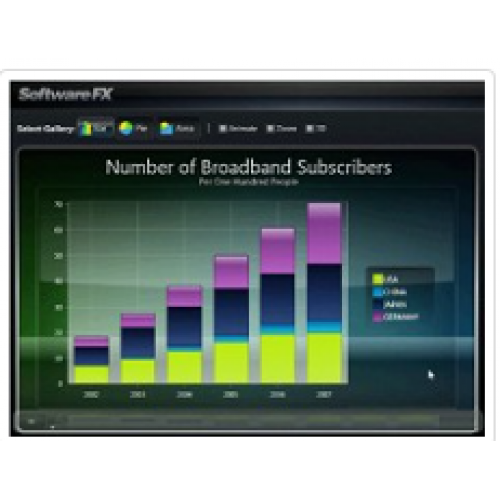
Beautiful style
The Chart FX for WPF provides impressive chart types, animation, design, layout, palette, frame, marking and multi axis, you can create a very visual appeal in minutes chart.
![]()
Fully customizable based on XAML
Developers and designers can fully customize the style of chart elements for the first time, and tightly couple Chart, FX, for, and WPF to their applications and user interfaces.
![]()
Powerful 3D engine
Chart FX uses WPF's 3D engine to allow users to manipulate any element of the chart, and also provides an attractive UI that allows you to analyze data more intuitively.
![]()
Innovative user interaction
The user can select any chart element to manipulate and provide user interface, making the data analysis process more powerful and intuitive.
![]()
Flexible data binding
With the magic WPF data binding, LINQ, and Chart FX features, you can easily fill in diagrams based on other controls, such as XML files, databases, and other basic data.
![]()
Seamless IDE integration
Chart FX for WPF maintains programmability, developer efficiency, and IDE integration on Visual Studio 2008 and Expression Blend.
![]()
| Component Property | |
| Component Type | WPF |
| Component Environments | |
| Version | 7.4 |
Chart FX for WPF 8.1
- Brand: SoftwareFX
- Product Code: ChartFXforWPF 8.1
- Availability: In Stock
-
¥6,200.00
Available Options
Tags: Chart FX for WPF 8.1